What is a Function?
It all begins with an idea.
A function is one of the most fundamental concepts in calculus. Here is the most basic one:
y = f(x)
In algebra, students are often taught to use methods such as substitution and elimination to solve equations like y = x + 4. In calculus, you will see functions that are very similar except that you will commonly see them written using f(x):
f(x) = x +4
How Does a Function Work?
Think of a function like a machine that you put a certain number into. The machine then gives you a different number based on the number you put in.
For example, say you have a machine that adds 1 to any number that you put in. If you put a 1 into it, the machine will give you a 2. If you put a 53 into it, you will get a 54. We could write this function like this:
y = f(x + 1)
The x represents the number that you put into the machine, and the y represents the number that the machine gives you. The y value will change depending on the number that you put into the machine (the x value). For this reason, we call the y value the dependent value, and the x number is the independent value.
We can also illustrate this function using an input/output table. Using the example of a function that adds one to the number you put in, y = f(x +1), the numbers would look like this:
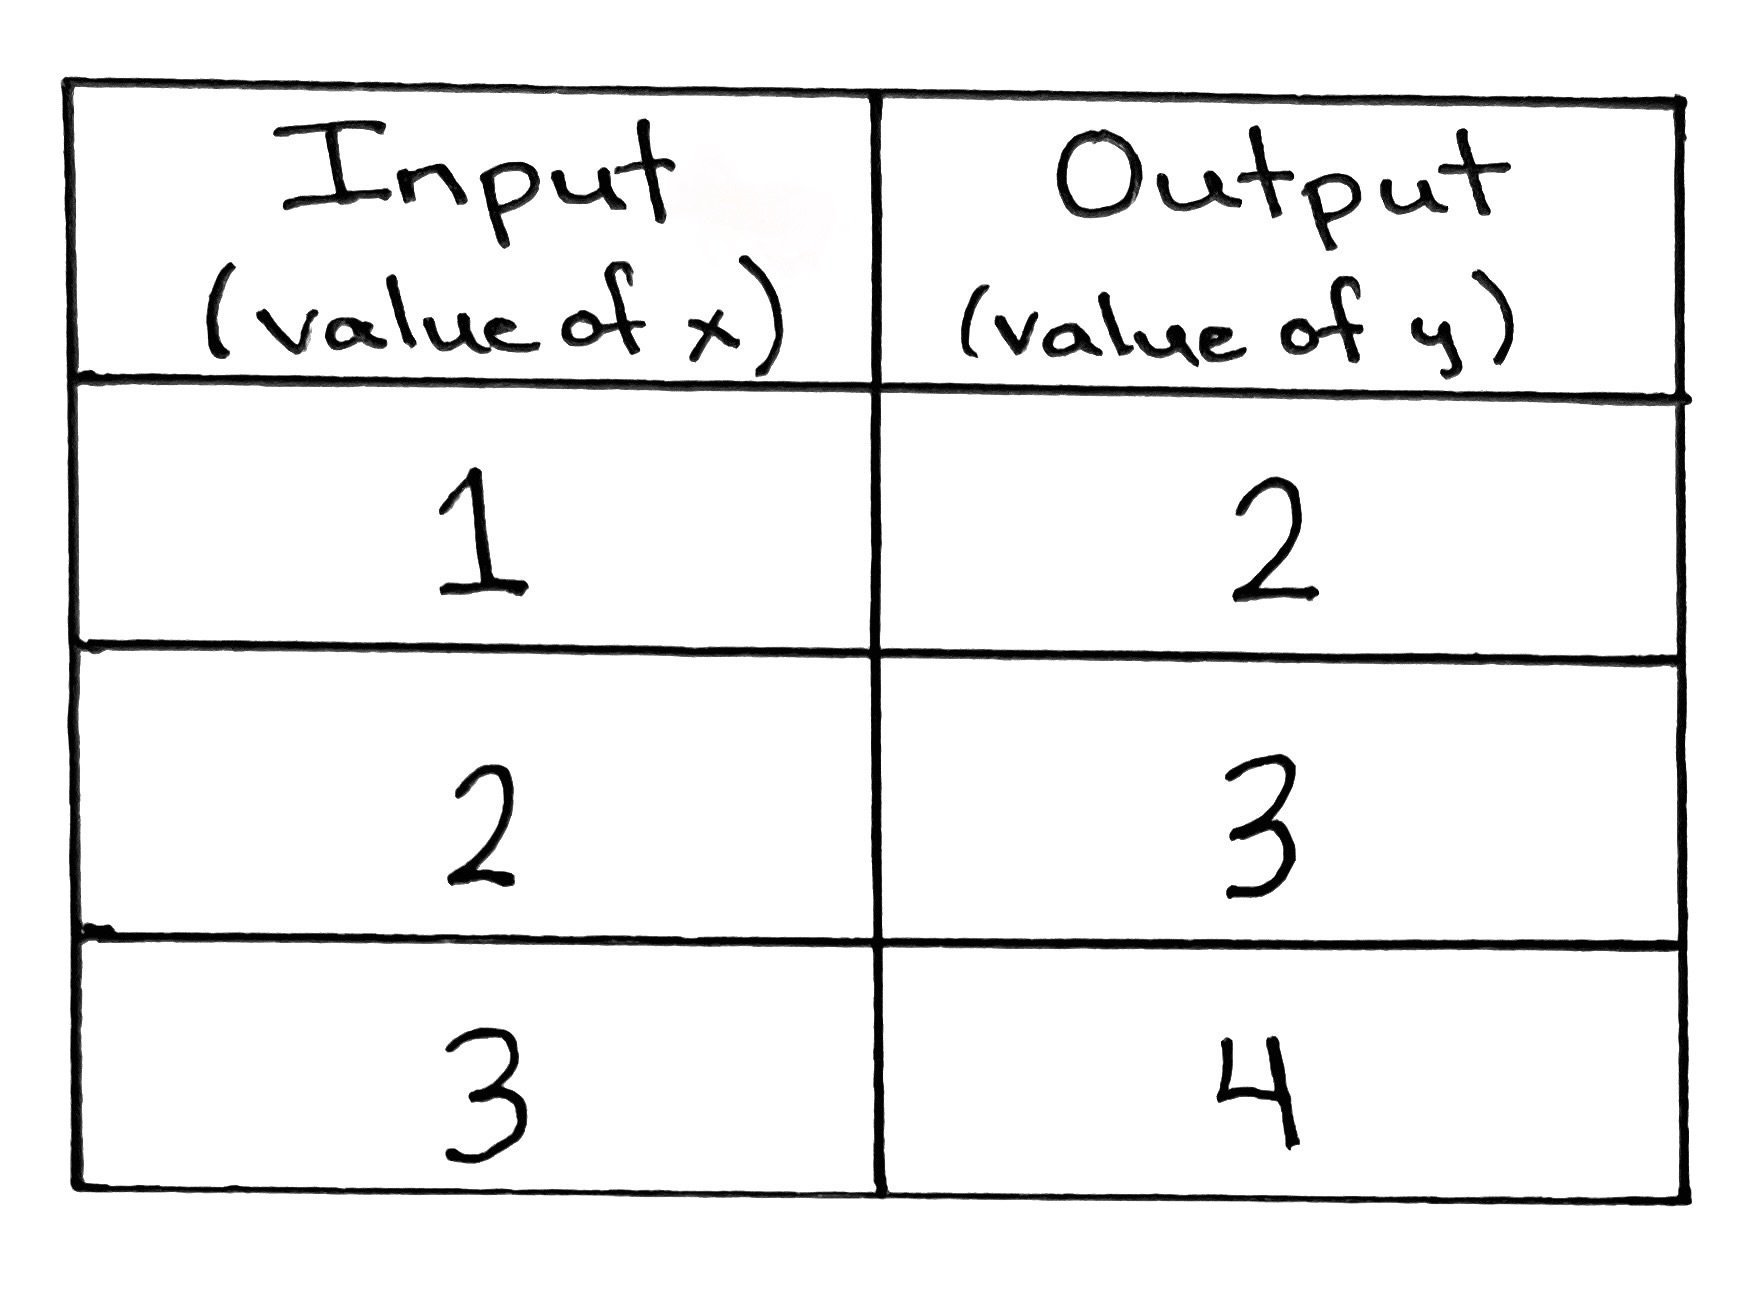
The first column represents all the numbers you put into the machine. These are the x values of your function. The second column (on the right) is all the numbers that the machine will give you after adding 1. These are the y values of your function.
How to Solve a Function for y, or f(x)
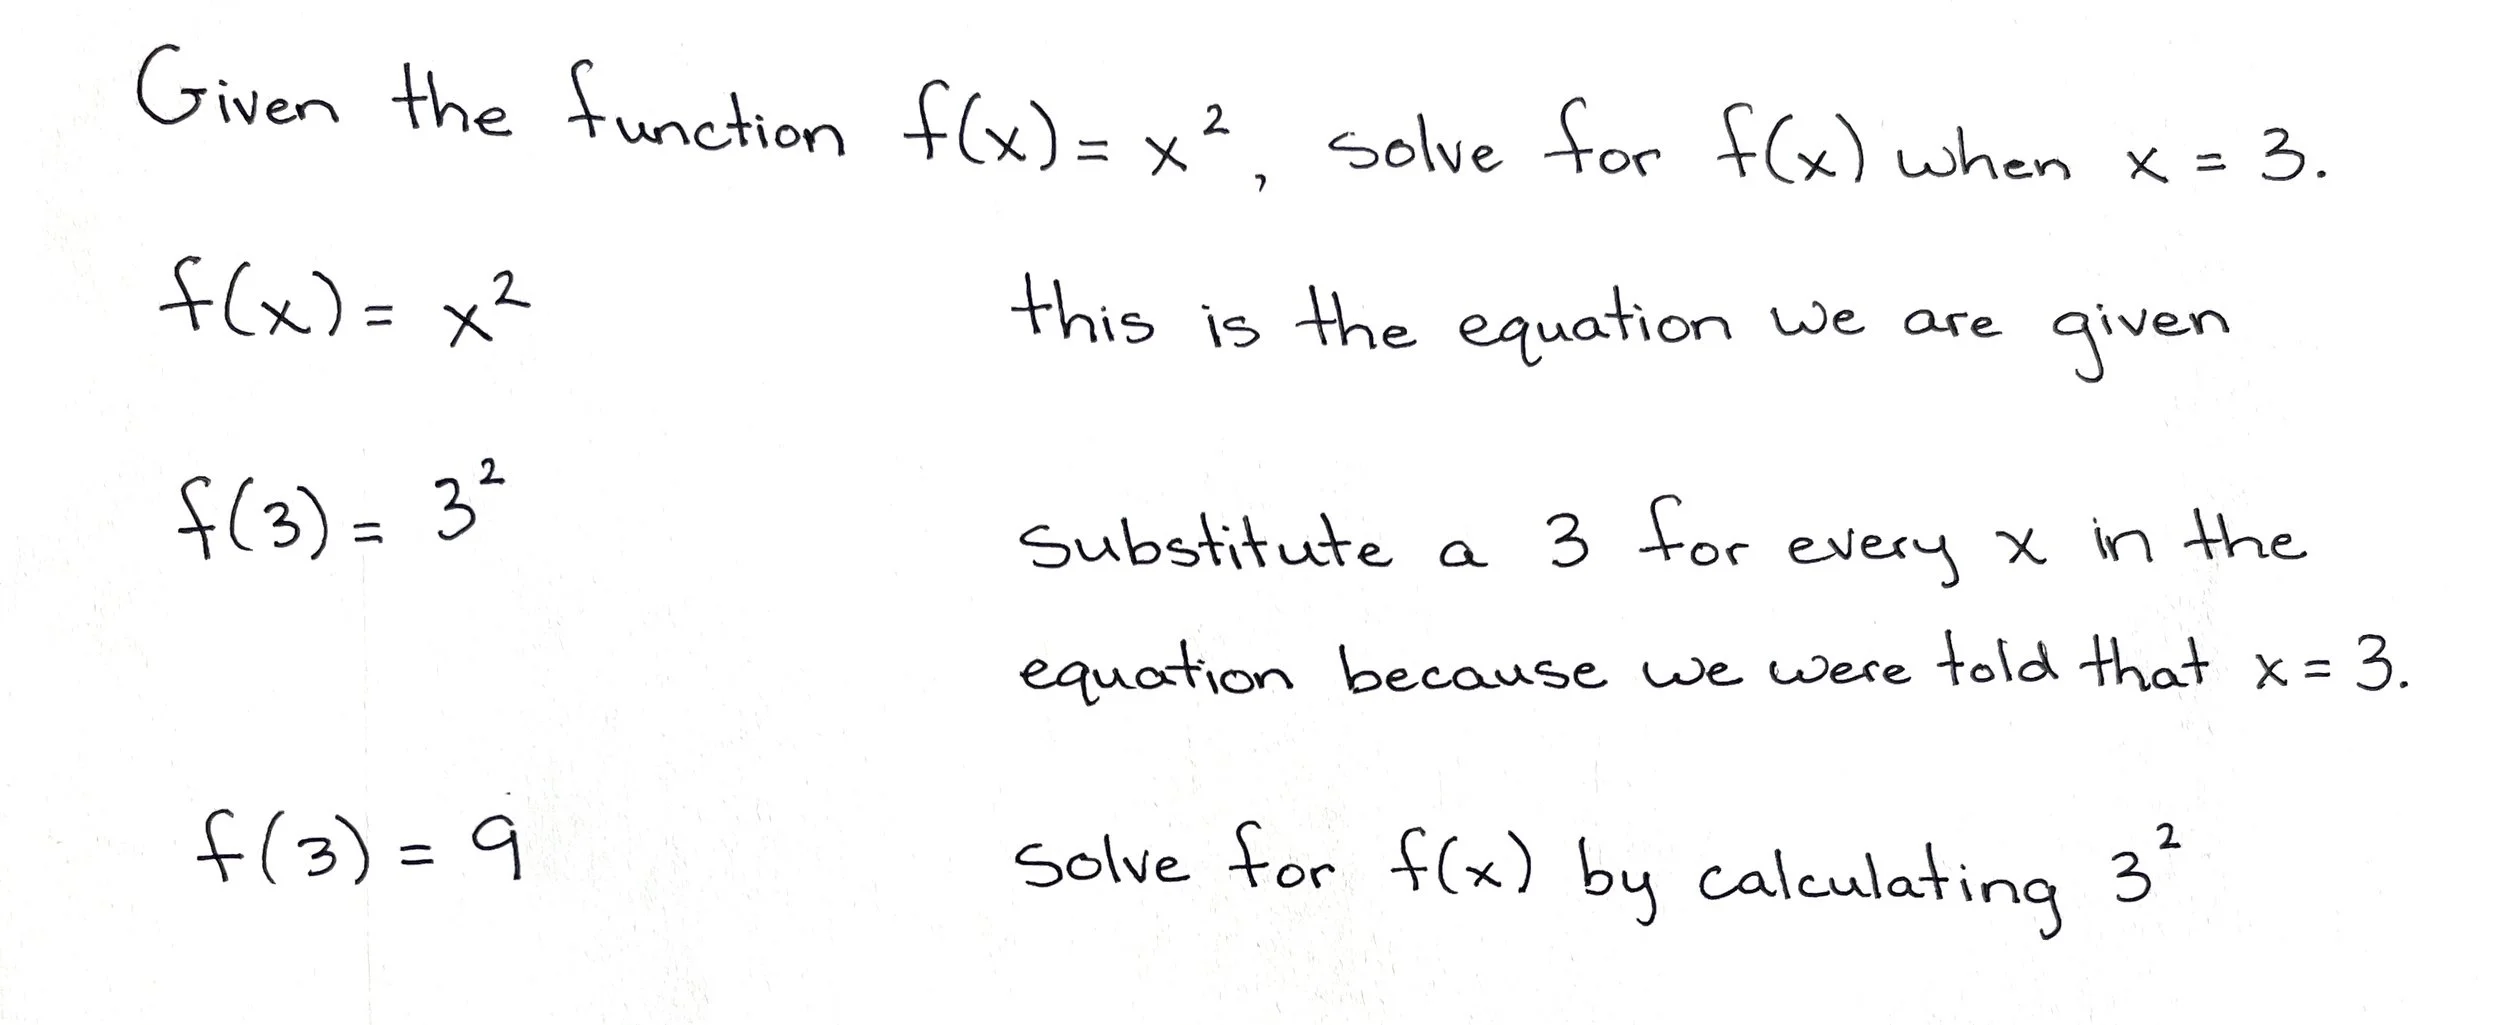
To solve a function for its y value, also written as f(x), input a given number into the function. We do this by replacing all the values of x in the function with the number given to us in the question.
Here’s an example:
Vertical Line Test
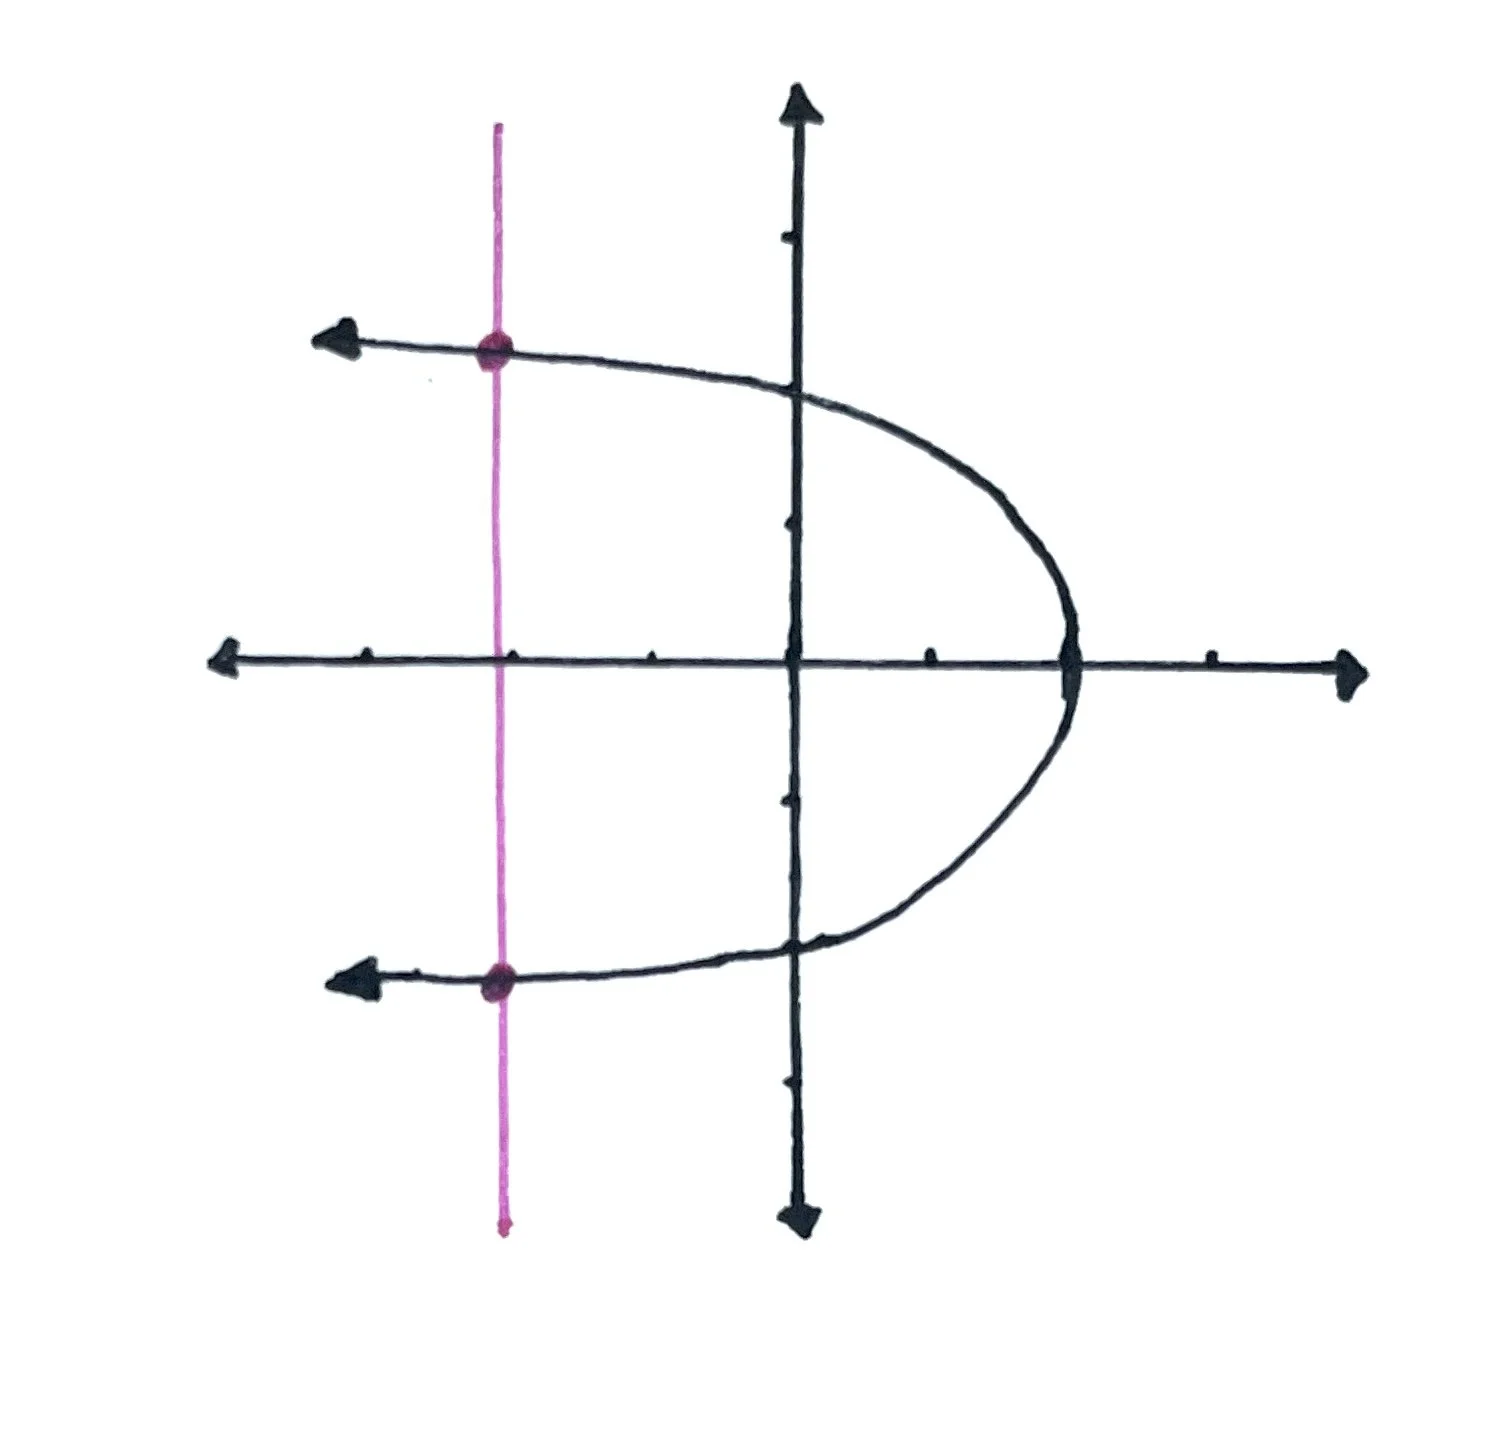
In order to test whether a given equation is a function, use the Vertical Line Test. Graph the function (see our lesson on how to graph functions here) or if provided, look at the graph of the function, and draw a vertical line through it. Look for areas where the line touches parts of the graph. Does the vertical line only touch the graph once?

In the image above, we drew a vertical line through the graph. Because the pink line only intersects the graph once, this is a function.
However, if the vertical line touches the graph more than once, it is not a function. Here’s an example:
In this example, the pink vertical line intersects the graph twice so we know that this graph does not represent a function.
Why does the Vertical Line Test work? In a function, there can only be one value of y for each value of x. If you plug a 2 into your function machine, you cannot get both a 1 and a 3 from it. You can only get one value. For example, if you plug a 2 into the function machine, you could get a 4 and nothing else. That would be a function. So, when a function is represented on a coordinate plane, the graph cannot intersect a value of y twice at the same point of x, as it does in the image above.
Key Points to Remember:
A function is an equation where one variable depends on the value of another variable.
y = f(x) so if you are asked to solve for f(x), you are solving for the y value.
To solve for y, input the given value of x into the function and solve.
To test whether something is a function, use the vertical line test on the graph of that function. Check to see if the vertical line intersects the graph more than once. If so, it’s not a function.
Additional Resources
Here is an excellent video from Organic Chemistry Tutor that covers the definition of a function, the vertical line test, common types of functions, and how to solve a function.
This video from Khan Academy describes functions using inputs and outputs and demonstrates how the Vertical Line Test works.
This video from MathEase is a quick 3-minute overview of what a function is, including excellent visual examples.
This article by Third Space Learning provides clear examples of what a function is and how it is represented through the use of several examples.
https://thirdspacelearning.com/us/math-resources/topic-guides/algebra/what-is-a-function/
Graphing Functions
It all begins with an idea.
To plot a function on a coordinate plane, it is often helpful to choose a few values of x and plug them into your given function. Solve for y and then use those coordinates to plot a general outline of your graph.
Here’s an example. I like to choose at least three values of x: one negative value, zero, and one positive value.
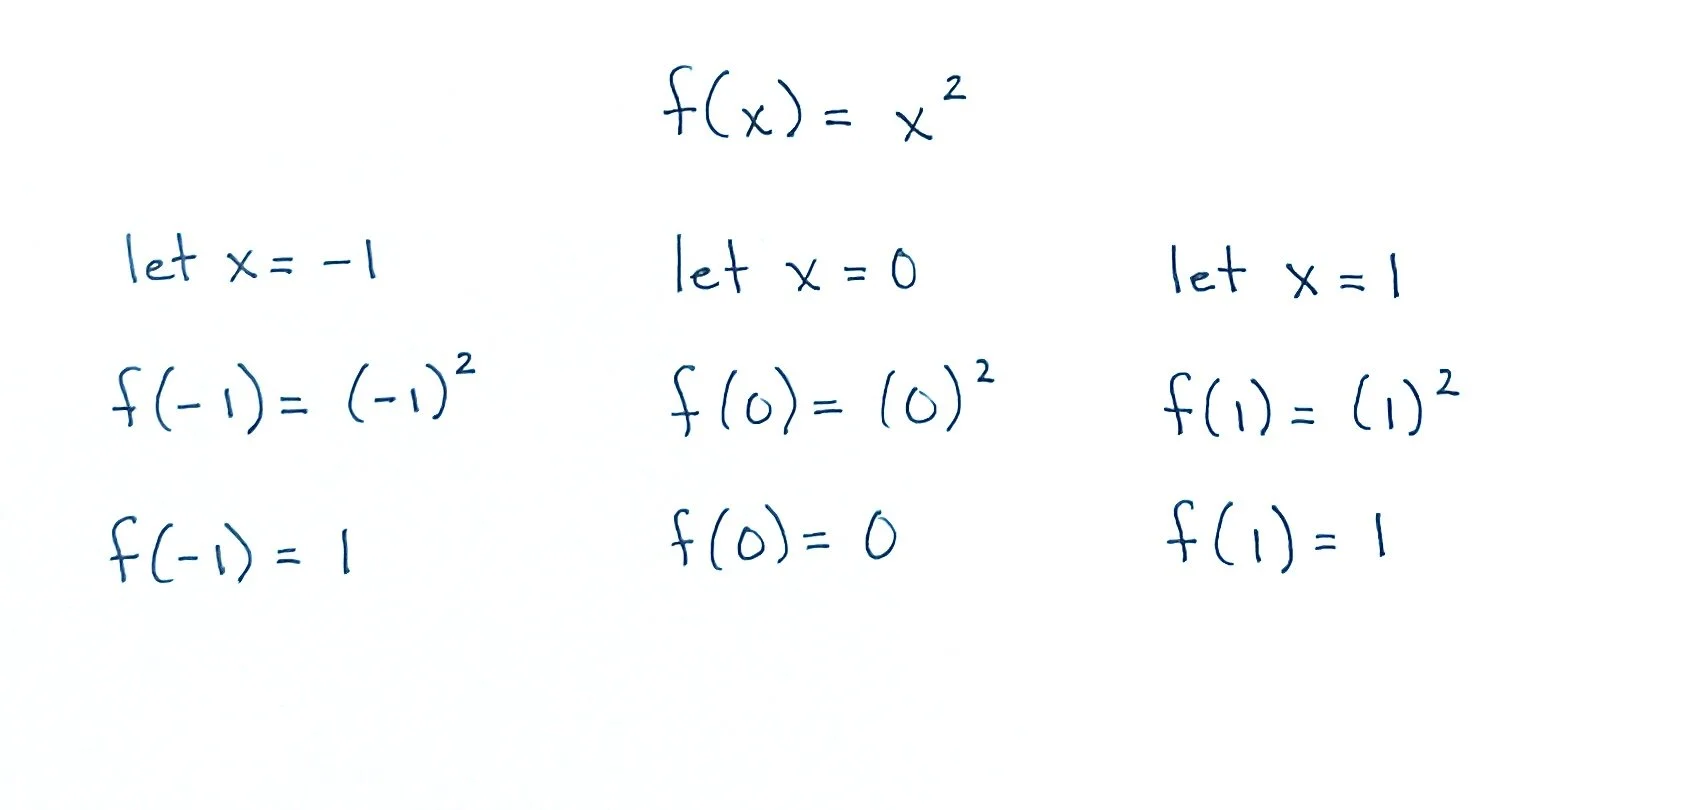
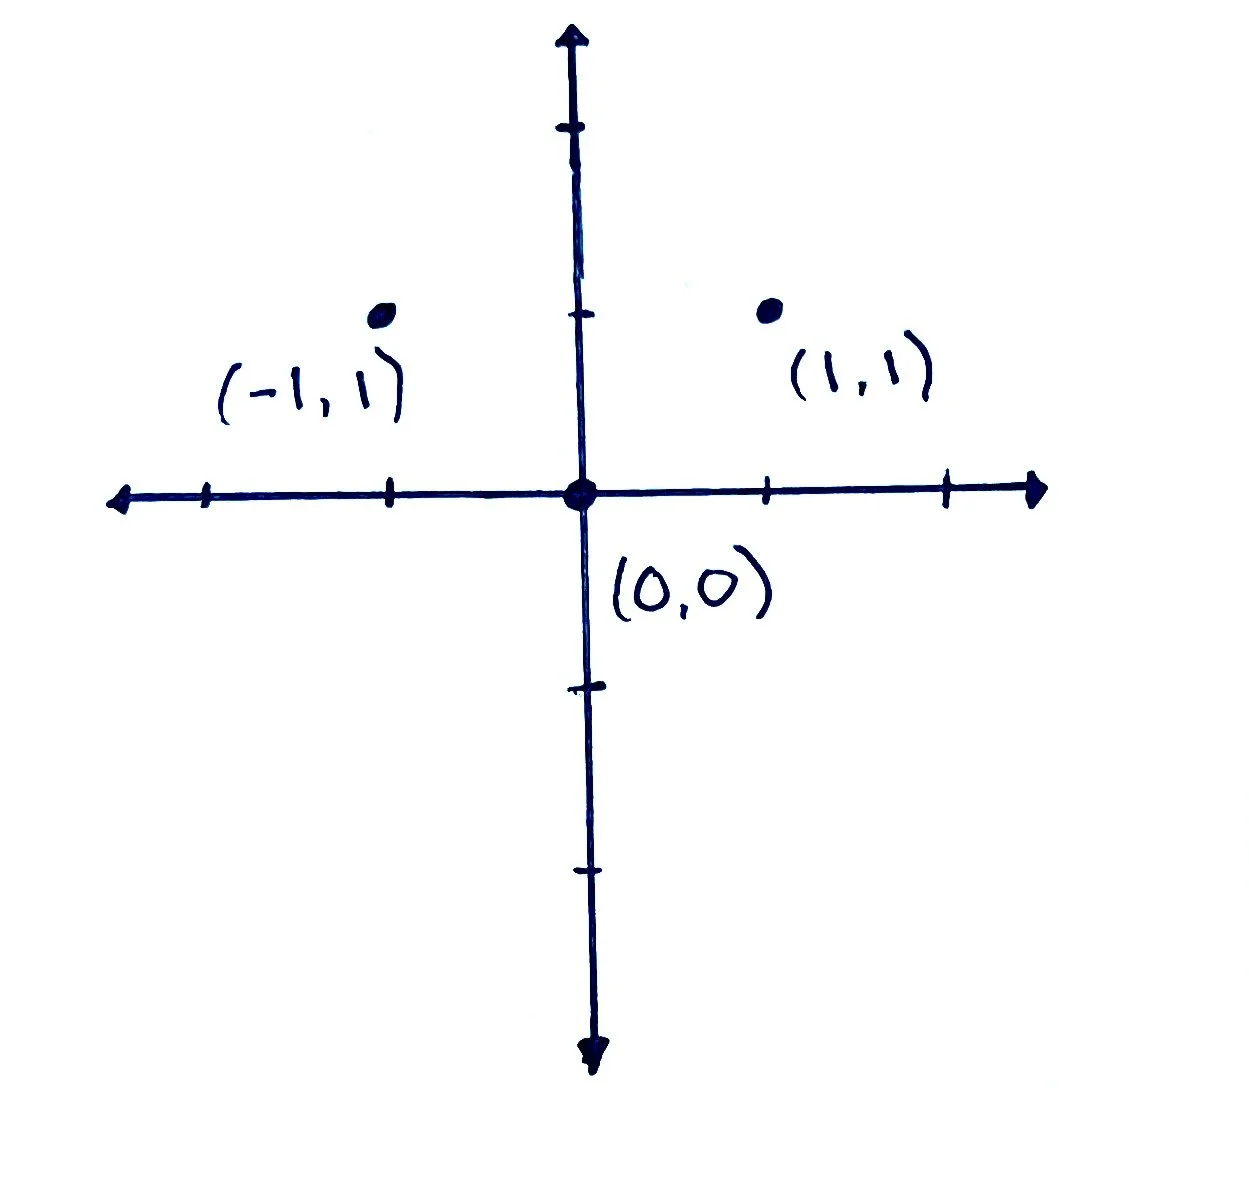
In the example above, we have chosen to calculate the y-value when x equals -1, 0, and 1. Using this information, we can now create three different sets of coordinates using these x and y values: (-1, 1), (0, 0), and (1, 1).
Next, we are going to plot each of these coordinates on a coordinate plane:
Now that we have plotted each of the coordinates on the graph, draw a line to connect each of the dots.
Then we can extend the line in either direction and add an arrow because the line will continue on forever, which we call ‘infinity.’
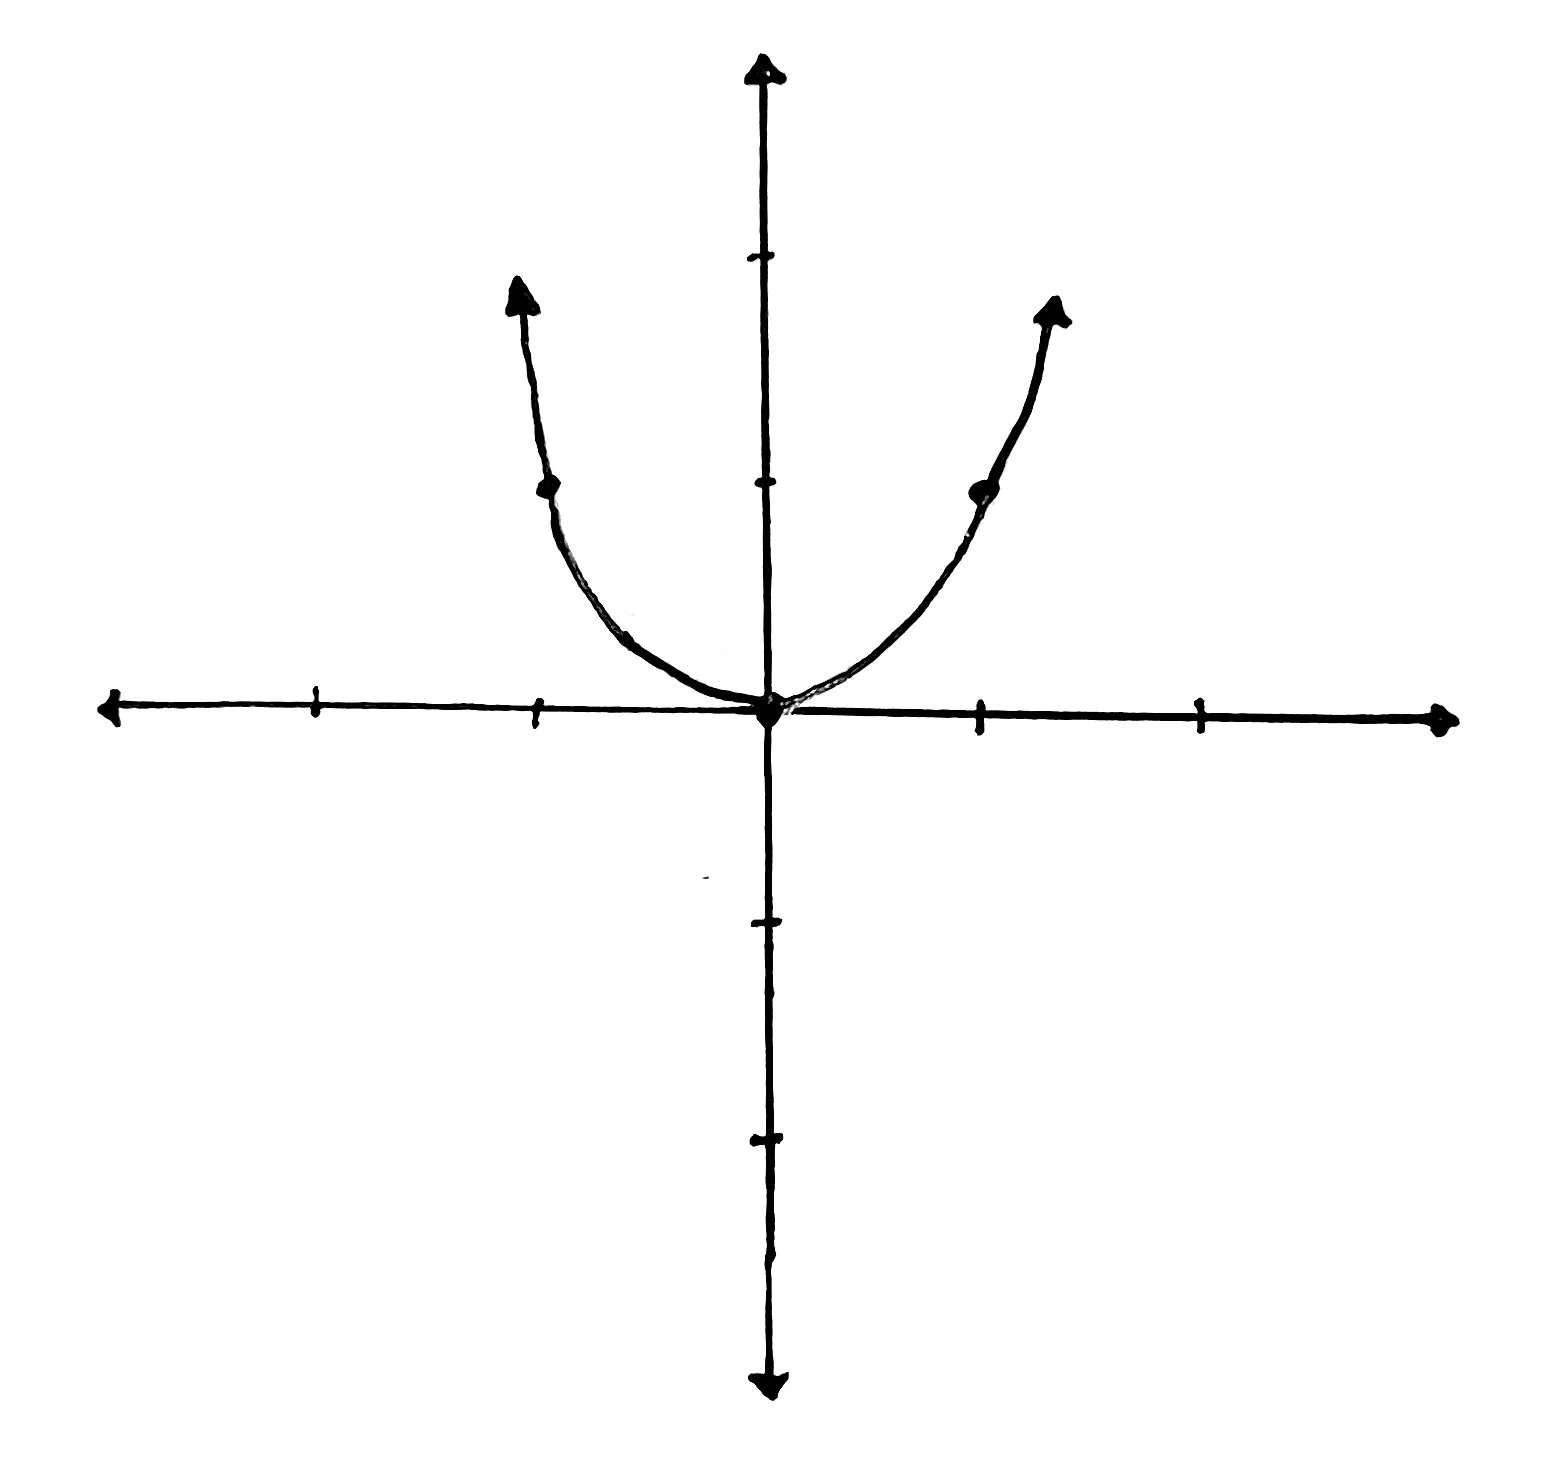
Now we have successfully graphed the function!
Things to Remember
To graph a function, choose a few values of x and solve for y to create coordinate points.
Plot those points on the coordinate plane.
Connect the points on the plane and extend the lines into infinity.
Additional Resources
Need more help? Check out these resources to help you learn more!
This video from Math Antics is geared toward algebra students, but it covered the basics very clearly. This video is great if you need a review of the coordinate plane and plotting coordinates.
A helpful resource to graph functions online is the Desmos Graphing Calculator. It’s important to know how to graph functions on your own but once you have moved on to more advanced topics, this is an excellent resource to save time or simply to check your work.