Graphing Functions
To plot a function on a coordinate plane, it is often helpful to choose a few values of x and plug them into your given function. Solve for y and then use those coordinates to plot a general outline of your graph.
Here’s an example. I like to choose at least three values of x: one negative value, zero, and one positive value.
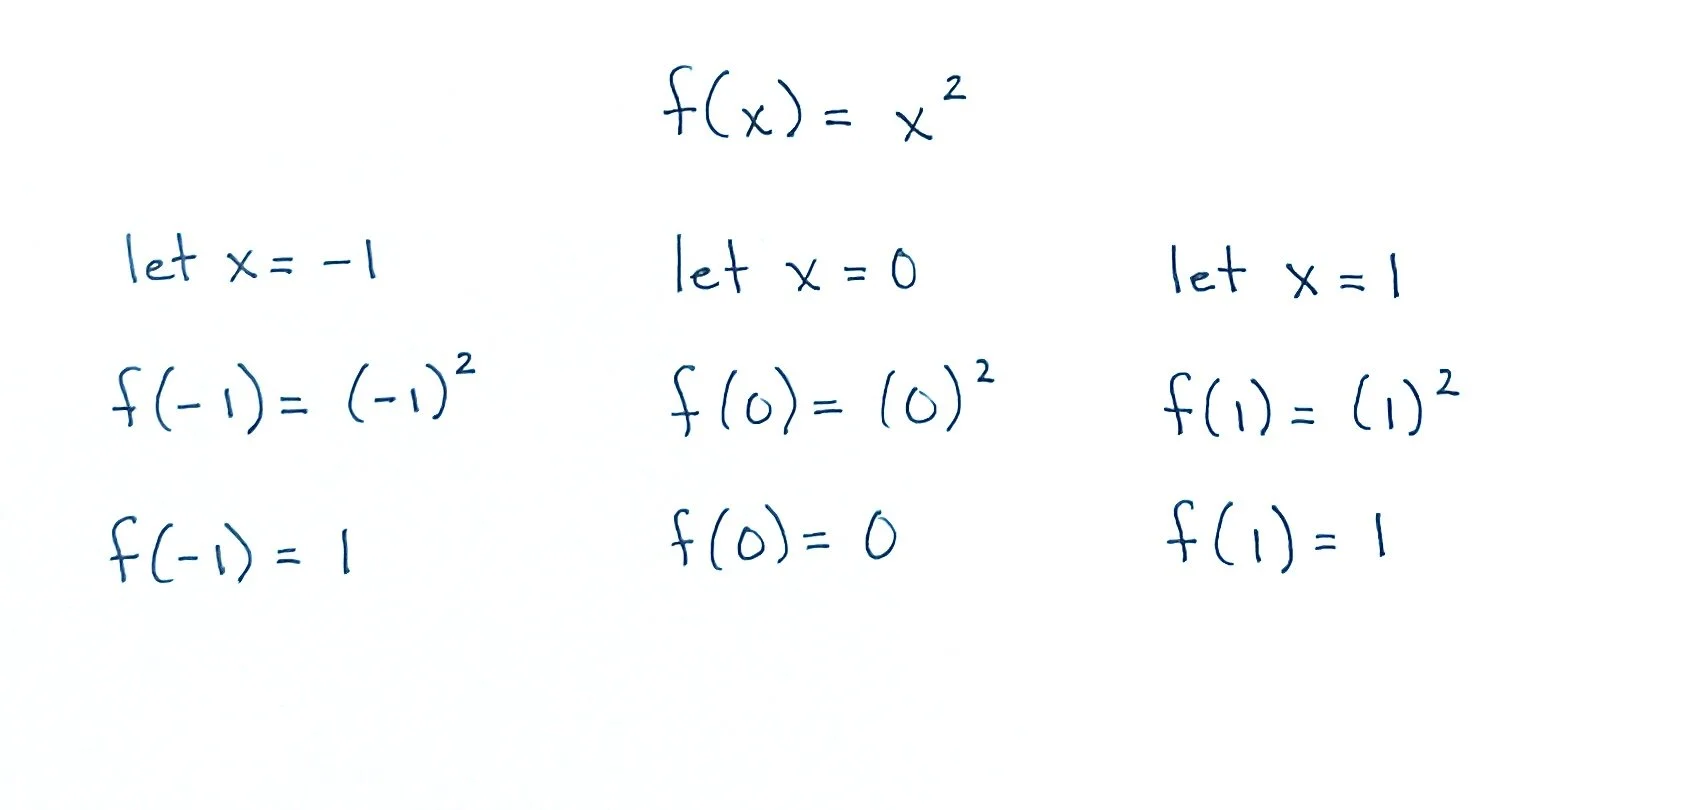
In the example above, we have chosen to calculate the y-value when x equals -1, 0, and 1. Using this information, we can now create three different sets of coordinates using these x and y values: (-1, 1), (0, 0), and (1, 1).
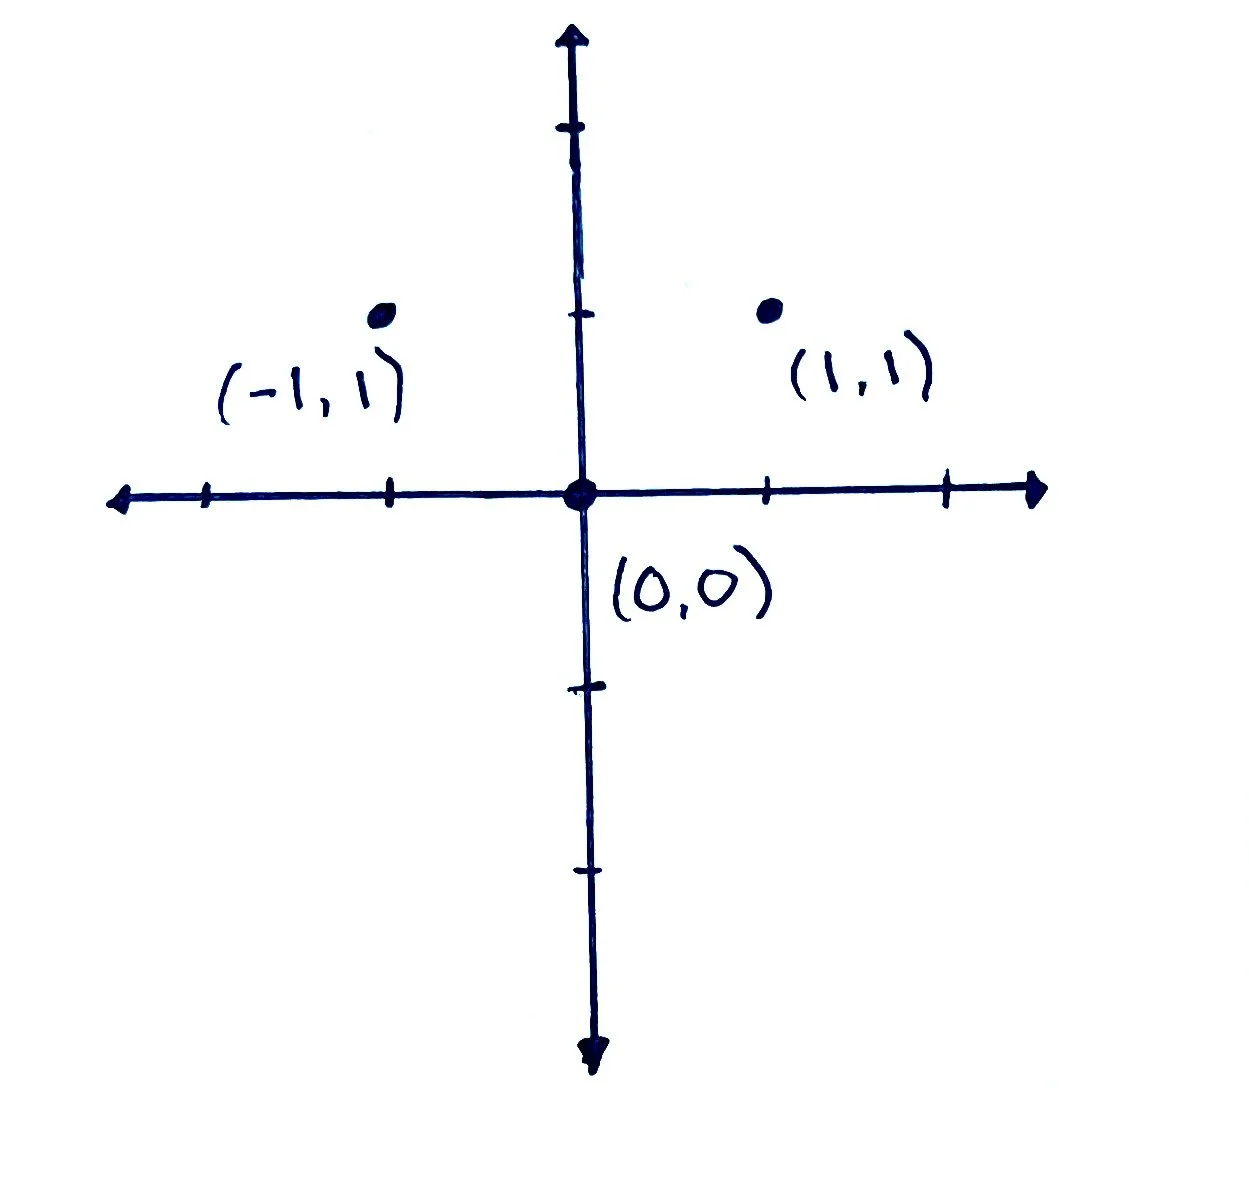
Next, we are going to plot each of these coordinates on a coordinate plane:
Now that we have plotted each of the coordinates on the graph, draw a line to connect each of the dots.
Then we can extend the line in either direction and add an arrow because the line will continue on forever, which we call ‘infinity.’
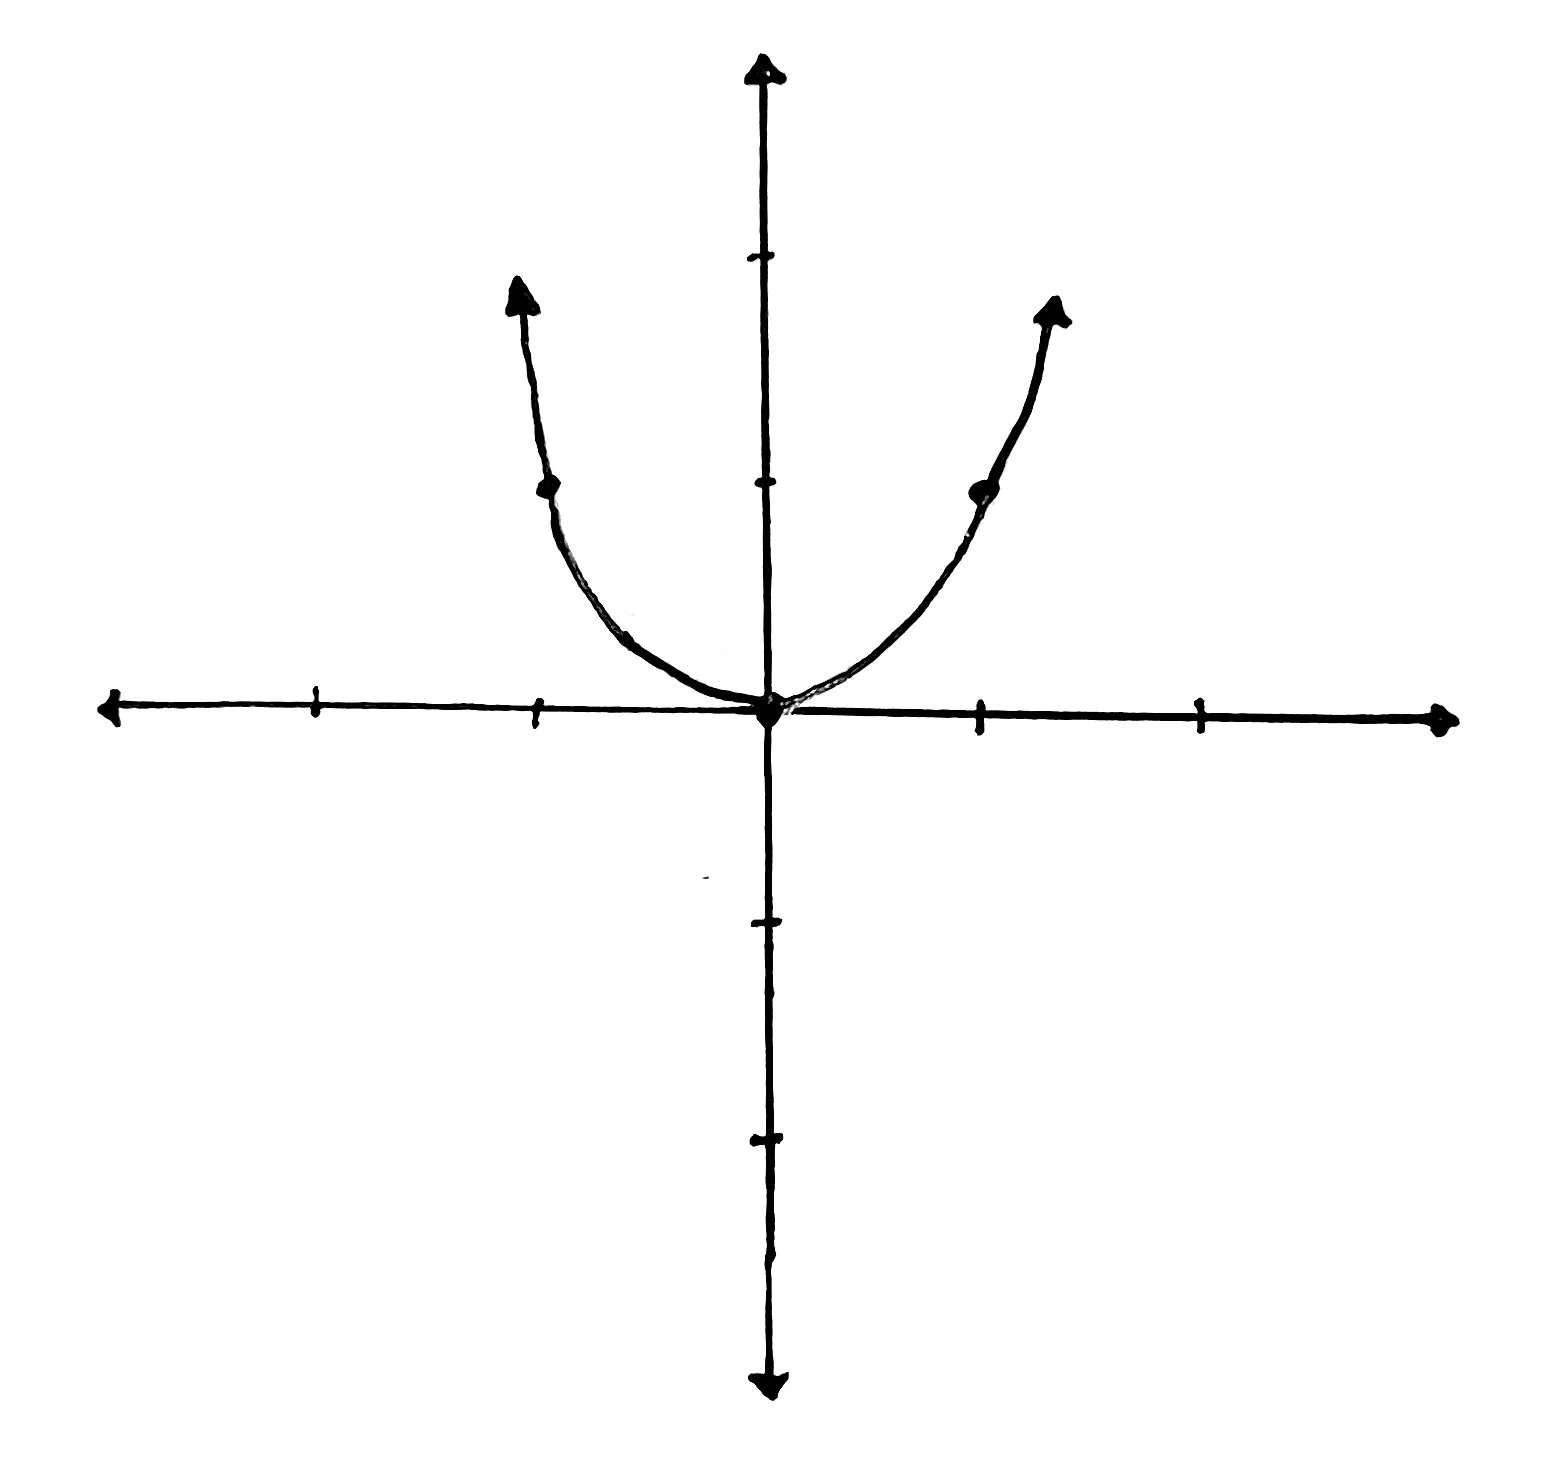
Now we have successfully graphed the function!
Things to Remember
To graph a function, choose a few values of x and solve for y to create coordinate points.
Plot those points on the coordinate plane.
Connect the points on the plane and extend the lines into infinity.
Additional Resources
Need more help? Check out these resources to help you learn more!
This video from Math Antics is geared toward algebra students, but it covered the basics very clearly. This video is great if you need a review of the coordinate plane and plotting coordinates.
A helpful resource to graph functions online is the Desmos Graphing Calculator. It’s important to know how to graph functions on your own but once you have moved on to more advanced topics, this is an excellent resource to save time or simply to check your work.