Domain and Range
To find the domain and range of this function, we first want to find a few of the (x, y) coordinates on the graph of the function. I start by selecting at least three values of x to plug into the equation. I like to start with a negative value of x, zero, and a positive value of x. So, in this example, I will select -1, 0, and 1. Plug each of these values into the original equation and solve for y:
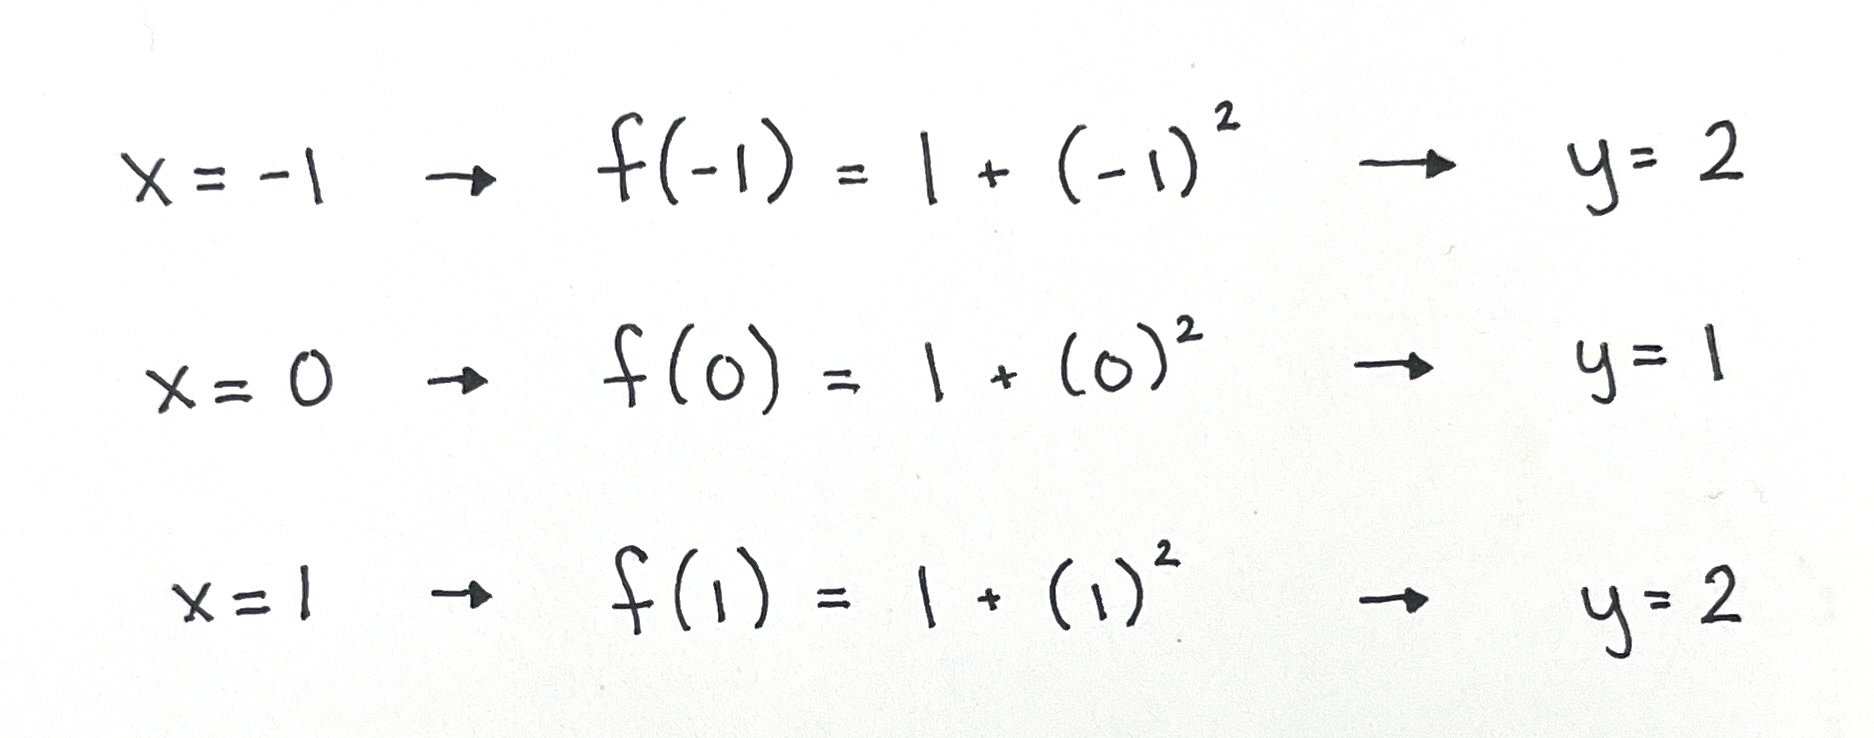
Now we can plot each of these (x, y) coordinates on a coordinate plane. We will plot (-1, 2), (0, 1), and (1, 2) and then connect the plotted points to form our graph.
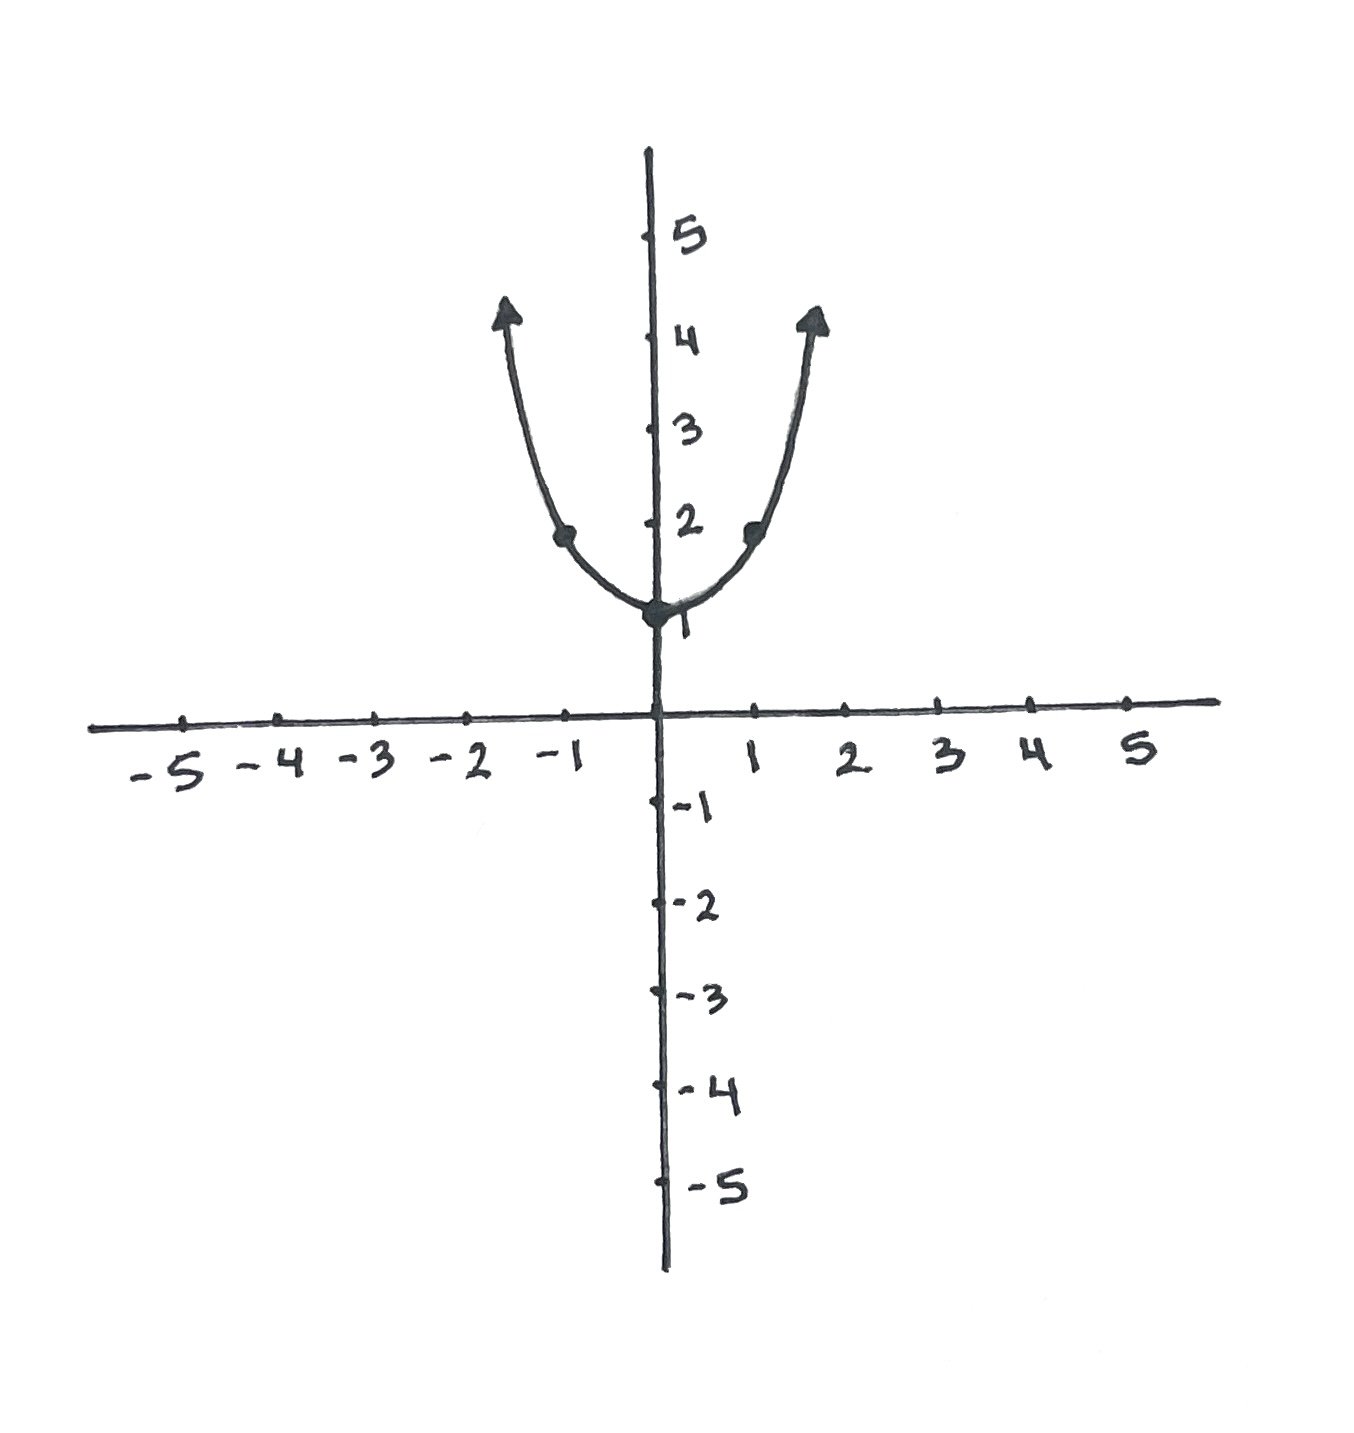
Now that we have our graph, we can use it to visualize the domain and range.
Remember that the domain is the set of all possible x values for the function. The x values lie along the horizontal x-axis. Looking at our graph, the arrow moves from the left to the right side of the graph to infinity in both directions. So, our domain is (-∞, ∞).
The range is the set of all possible y values for the function, based on the possible x inputs. The y values lie along the vertical y-axis. Looking at our graph, if we start from the bottom of the y-axis, we cannot get a value of y until we reach y = 1. The values of y continue moving up the graph into infinity. So, our range is [1, ∞).
Answer: Domain: (-∞, ∞) Range: [1, ∞)